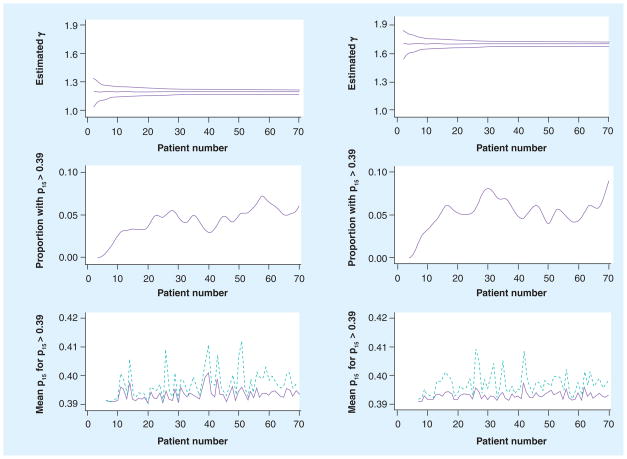
Figure 4. Operating characteristics of the adaptive aspects of the trial.
The left column is for simulated trials where the true value of γ is 1.2, and the right column where the true value is 1.7. The top row displays the median and 5 and 95% percentiles of posterior distribution of γ as the patient number increases. The middle row shows the proportions of patients with k2i > 0.39. The bottom row displays the mean (solid line) and maximum (dashed line) of k2i for those patients with k2i > 0.39.
p15: 15 min after administration.

