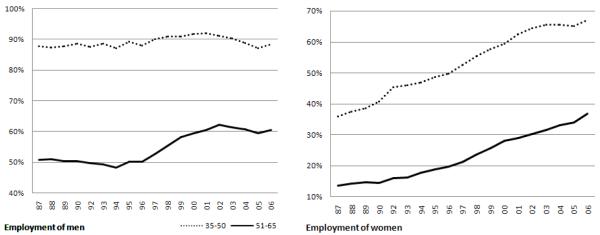
Figure 1.
Employment Rates. Source: Enquete Beroepsbevolking, Statistics Netherlands; 80,000 to 120,000 observations for each cross section. The variable is not available for the year 1991. Observations are weighted with cross sectional weights. The percentages represent the share of working population in the total of those working, unemployed or not belonging to the labor force.

