Figure 3.
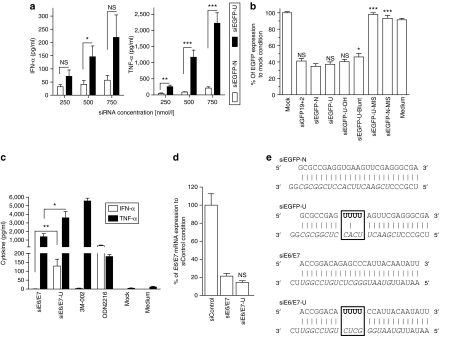
Validation of uridine-bulge siRNA design scaffold. Human peripheral blood mononuclear cells were treated with indicated concentration of (a) specified siRNA or (c) 750 nmol/l complexed with N-[1-(2,3-dioleoyloxy)propyl]-N,N, Ntrimethylammonium methylsulfate and incubated for 16 hours at 37 °C. Cytokine production was measured by specific enzyme-linked immunosorbent assay. (a) The data are averaged from four independent experiments in four blood donors. Unpaired two-tailed nonparametric Mann–Whitney tests are shown. (b) RNA interference efficiency of enhanced green fluorescent protein (EGFP) siRNAs. HEK 293 cells stably expressing EGFP were transfected with 10 nmol/l of indicated siRNA for ~48 hours. EGFP production was assayed in fluorescent plate-reader as described in Materials and Methods. The data are presented as the EGFP protein concentration relative to that of the mock-transfected control, and are averaged from three independent experiments in biological triplicate. siGFP19+2 is a 21-bp siRNA targeting EGFP,4 siEGFP-U-MIS and siEGFP-N-MIS bear two mismatches with the target sequence (see Figure 4a), and siEGFP-U-Blunt and siEGFP-U-OH have altered termini (Supplementary Table S1). Unpaired two-tailed t-test is presented using siEGFP-U as a reference. (c) The data are averaged from two blood donors in biological triplicate and are representative of two independent experiments. Unpaired two-tailed nonparametric Mann–Whitney tests are shown. (d) Knockdown efficiency of siRNAs transfected in Murine TC-1 cells at a final concentration of 10 nmol/l. After 24 hours at 37 °C, total RNA was extracted and reverse-transcribed as described in Materials and Methods. The E6/E7 mRNA was assessed by quantitative real-time PCR, and presented relative to that of mouse GAPDH. The data are expressed as percentage fold expression of siControl, and are averaged from two independent experiments in biological triplicate. Unpaired two-tailed t-test comparing siE6/E7 and siE6/E7-U is shown using siE6/E7 as a reference. (e) Details of siEGFP and siE6/E7 designs. Watson–Crick base-pairing is shown with a “і” symbol, the 19-nt target-specific sequence of the guide strand is in italics, and the “U” bulge immunostimulatory motifs added to the native sequences are in bold. IFN, interferon; siRNA, short-interfering RNA; TNF, tumor necrosis factor.

