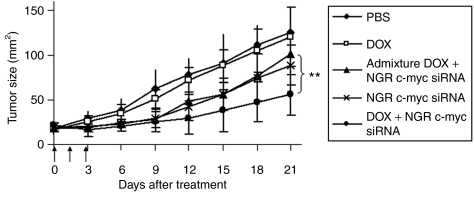
Figure 7.
HT-1080 xenograft tumor growth inhibition by siRNA and DOX in different formulations. Solid arrows indicate the intravenous administrations of siRNA (1.2 mg/kg) and DOX (0.3 mg/kg). Data = mean, n = 5–7. SD of the data points is not shown for clarity. **P < 0.01. DOX, doxorubicin; PBS, phosphate-buffered saline.

