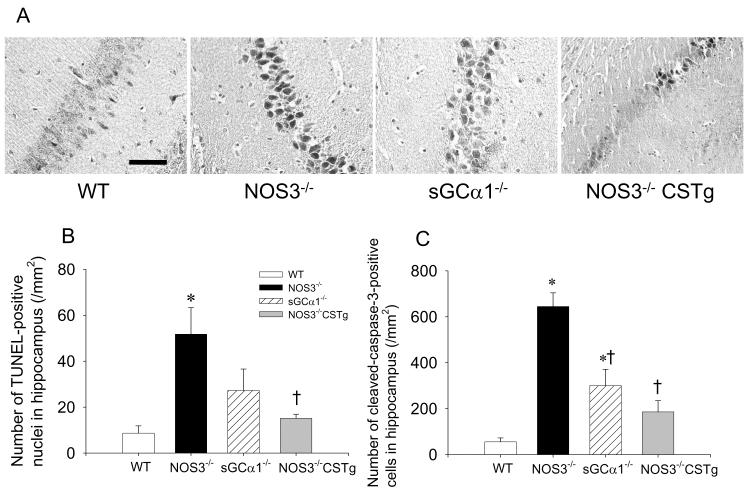
Figure 5.
(A) Representative images of cleaved caspase-3 immunohistochemistry in the hippocampal CA1 region of WT, NOS3−/−, sGCα1−/−, and NOS3−/− CSTg. Size bar indicates 50 μm. (B) Number of TUNEL-positive nuclei in the CA1 and CA3 regions of hippocampus in WT (open bar), NOS3−/− (black bar), sGCα1−/− (hatched bar), and NOS3−/− CSTg (gray bar). (C) Number of the neurons stained positively with cleaved caspase-3 antibody in the CA1 and CA3 regions of hippocampus in WT (open bar), NOS3−/− (black bar), sGCα1−/− (hatched bar), and NOS3−/− CSTg (gray bar). *P<0.05 vs WT after CPR. †P<0.05 vs NOS3−/− after CPR (2-way ANOVA).

