
Fig. 1.
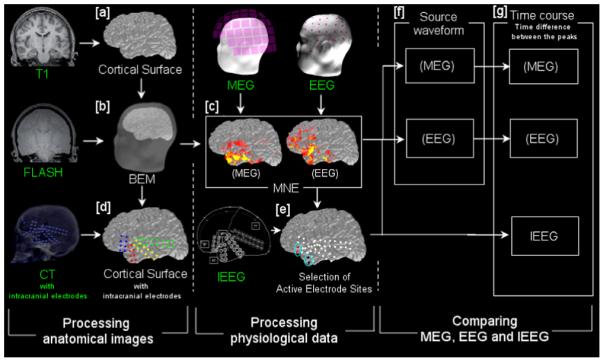
Illustrated procedure of the analysis
The steps of our procedure. The steps are classified into three major groups: (i) processing of anatomical images; (ii) physiological analysis of MEG, EEG and IEEG, and (iii) comparing MEG, EEG and IEEG time courses. Data shown with a green label is obtained directly from the patients. White labels show the data generated from the green-labeled or other processed (white-labeled) data. [a] Cortical surface reconstruction. [b] A head model is obtained from the cortical surface and multi-echo fast low-angle shot pulse sequences (FLASH) by using a boundary elemental method (BEM). [c] Spatiotemporal source distribution of MEG and EEG spikes is obtained by using minimum norm estimate (MNE). The map is shown on the cortical surface, with red and yellow indicating the cortical activation. [d] The location of intracranial electrodes is determined by co-registering the patient’s post-implantation computed tomography (CT) images onto the cortical surface. [e] Two frequently spiking sites of intracranial electrodes are selected each of anterior temporal and inferior frontal lobes. [f] Source waveforms are extracted from the MNE-derived spatiotemporal source distribution of each MEG and EEG spike, at the sites selected in [e]. [g] Time differences between the temporal and frontal peaks are obtained for each of MEG- and EEG-source waveforms and IEEG spikes.