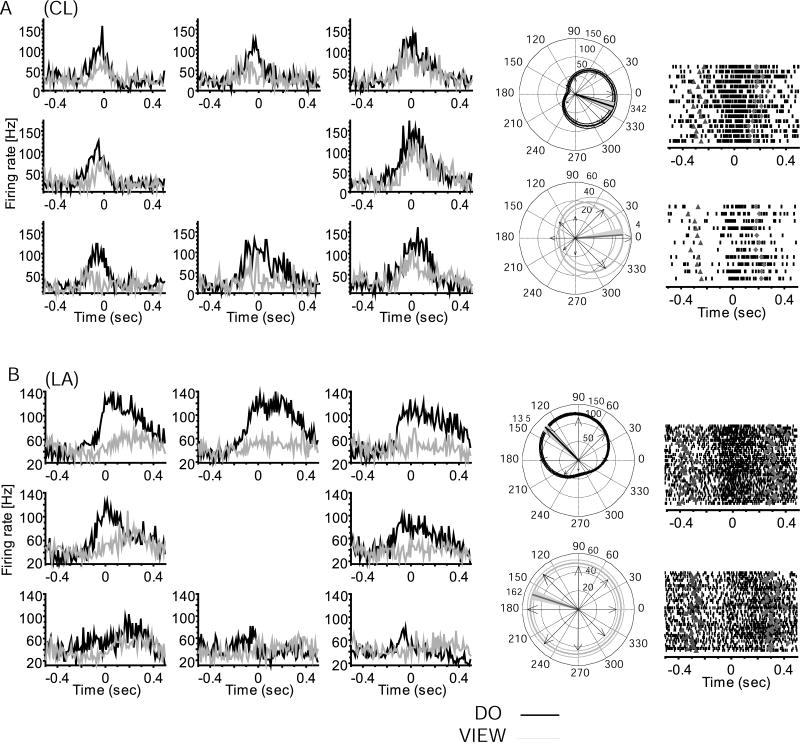
Figure 1.
Comparison of neural activity during performance and viewed action. Neurons in A, B show view task-related firing and directional tuning during action observation PD(view)=4°±8° (bootstrap, p<0.001), PD(view)=162°±6° (p<0.001). Left, perievent histograms of average firing across all trials aligned on the start of movement (time 0) showing do (black) and view (gray) task-related activity for example MI neurons in monkey A) CL, and B) LA. Histograms are placed at the respective target locations. Do and view task related firing for each of 8 directions, where a rightward movement is towards 0° (middle-right histogram), and an upward movement is towards 90° (top-center histogram). Center: circular plots showing directional tuning in do (black, above) and view (gray, below). Arrows plot observed peak firing for each direction. The firing rate scale is reported near the 90° line; the circular plot shows the best fit cosine function with (95% confidence limit) for the best fit model; the thick straight line marks the PD and the gray shadow indicates the 95% confidence interval. For (A) PD(do)=342°±7° (bootstrap, p<0.001), (B) PD(do)=135°±5° (p<0.001). Right, rasters showing firing rate for trials in each neuron's PD(do) (up) and PD(view) (down), aligned on the start of movement (0); the earlier triangles mark go cue; diamonds mark the end of movement. Note that firing in view task is reduced and more variable than in do task, but these neurons retain tuning and movement relationship across the two conditions.

