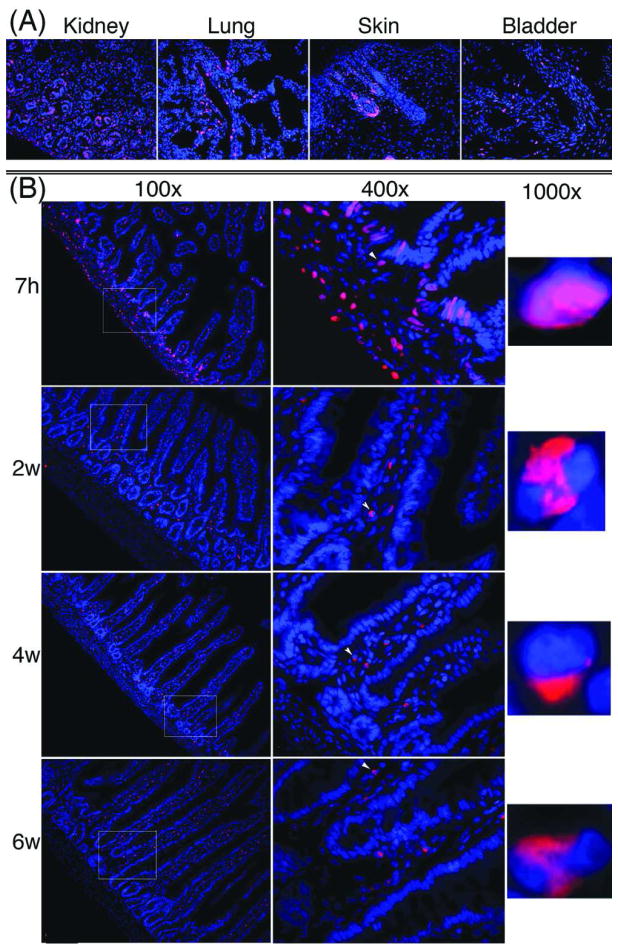
Figure 2.
EdU labeling of tissues. Newborn rats received intraperitoneal injection of 50 μg of EdU per g body weight. Major organs and tissues were harvested at 7h, 2w, 4w, and 6w and stained with Alexa-594 (red fluorescence) and DAPI (blue fluorescence). The Alexa-594 and DAPI stained images were digitally merged. (A) Four representative 7h tissues at 200× magnification. (B) Intestine at all 4 time points. Boxed areas in the 100× graphs are shown in the corresponding 400× graphs. Arrowheads in the 400× graphs point to nuclei that are shown in the corresponding 1000× graphs.

