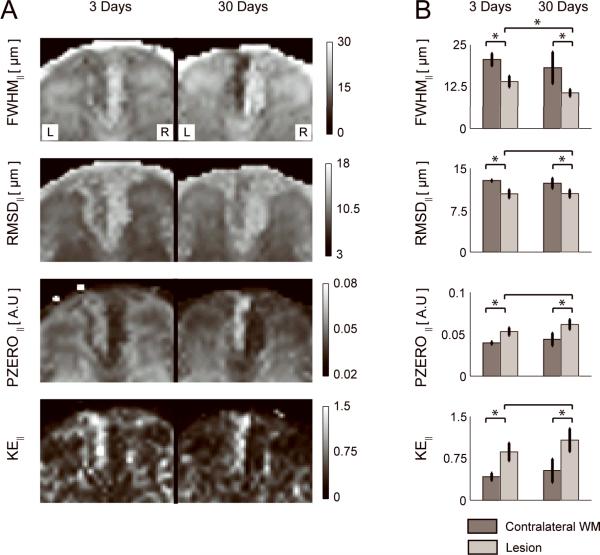
Figure 4.
A) Maps of the full width at half maximum (FWHM∥), root mean square displacement (RMSD∥), height (PZERO∥), and kurtosis excess (KE∥) of the PDF for parallel diffusion in an animal at 3 days (left image) and another animal at 30 days (right image) post-axotomy. B) ROI analysis of the q-space contrasts in the contralateral WM (dark bars) and lesion (light bars) over the 6 animals in each group. * denotes significant difference (p < 0.01).

