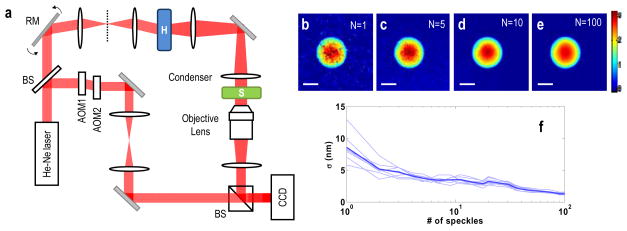
Fig. 2.
(a) Experimental setup. BS: beam splitter, GM: galvanometer mirrors, H: a holographic diffuser, S: sample, Condenser: Nikon 1.4NA, Camera: (Fastcam 1024 PCI, Photron), AOM1,2: acousto-optic modulators for temporal modulation of interference by shifting the frequency of the reference beam. (b–e) Averaged phase images where N is the number of speckle fields used for averaging. Scale bar indicates 5 μm and color bar indicates radian. (f) Standard deviation of phase noise as a function of the number of speckle fields used for averaging. Thin lines indicate the averaged phase for an area of 4×4 μm2 located outside of the sample. Thick line shows the averaged phase for 6 different areas.

