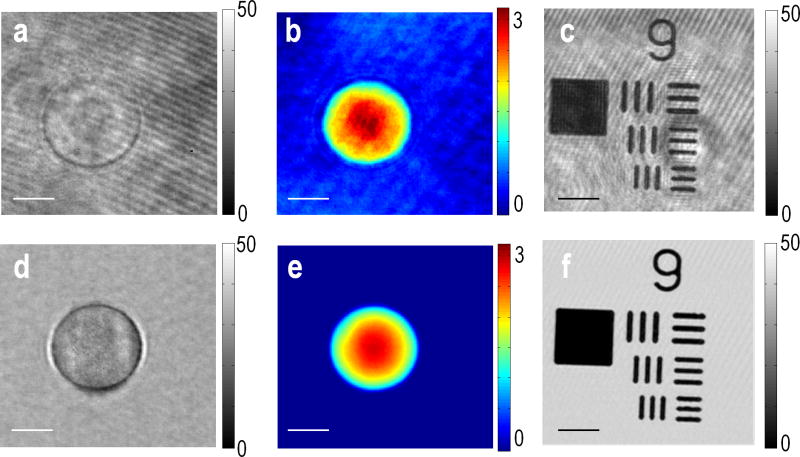
Fig. 3.
(a) Amplitude and (b) phase images of the E-field measured for a 10 μm polystyrene bead with a conventional HPM. (d) Amplitude and (e) phase images of the same sample measure by SDHM. (c, f), Amplitude images of USAF resolution (group 9) target measured by conventional HPM and SDHM, respectively. Scale bar indicates 5 μm, and colorbars indicate arbitrary unit for amplitude images and radians for the phase images, respectively. For SDHM, 100 raw images are processed to reduce singularity points.

