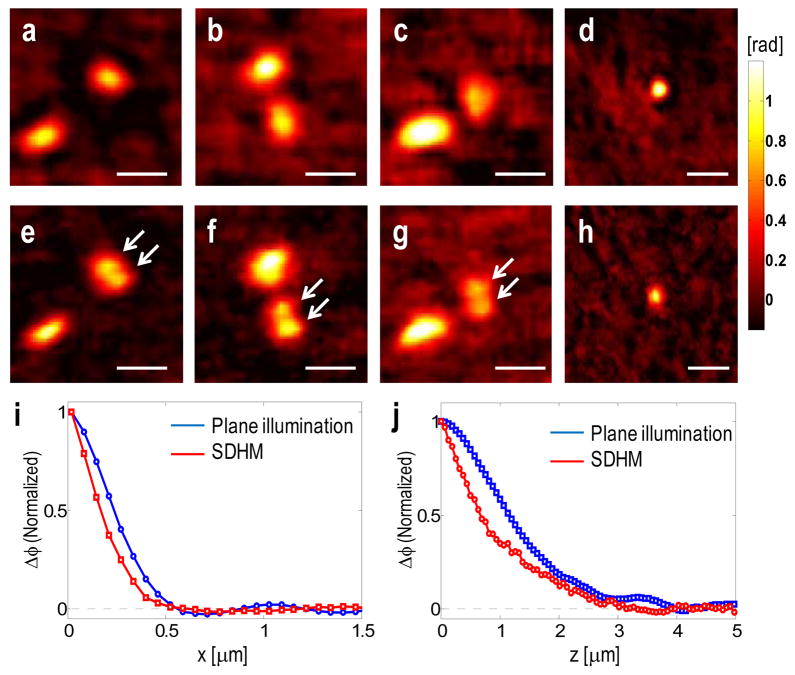
Fig. 4.
Speckle illumination increases lateral and axial resolving power. (a–d) Phase maps of polystyrene beads (200nm diameter) measured with a conventional HPM. (e–h) Phase maps measured with a speckle illumination of the same samples in (a–d). Scale bar indicates 500 nm. (i) Lateral point spread functions of a conventional HPM (blue line) and a speckle illumination (red line). (j) Axial point spread functions of a conventional HPM (blue line) and a speckle illumination (red line). For SDHM, 50 raw E-field images are processed to reduce singularity points.

