Fig. 5.
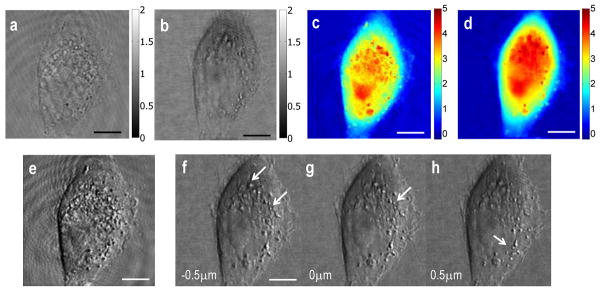
3D live cell imaging using SDHM. (a–b) Amplitude maps of a HeLa cell measured with (a) HPM and (b) SDHM, respectively. Color bar indicates arbitrary unit of amplitude. (c–d) Quantitative phase maps of the same cell imaged using HPM and SDHM, respectively. Color bar indicates phase in radian. (e) Emulated differential interference contract (DIC) images of the same cell taken by HPM. (f–h) Emulated DIC images by SDHM; (f) and (h) show numerically propagated DIC images 0.5 μm below and above form the original focus plane (g), respectively. Arrows indicate sub-cellular particles or vesicles focused on the specific focal planes. Scale bar indicates 5 μm. For SDHM, 50 raw E-field images are processed to reduce singularity points.

