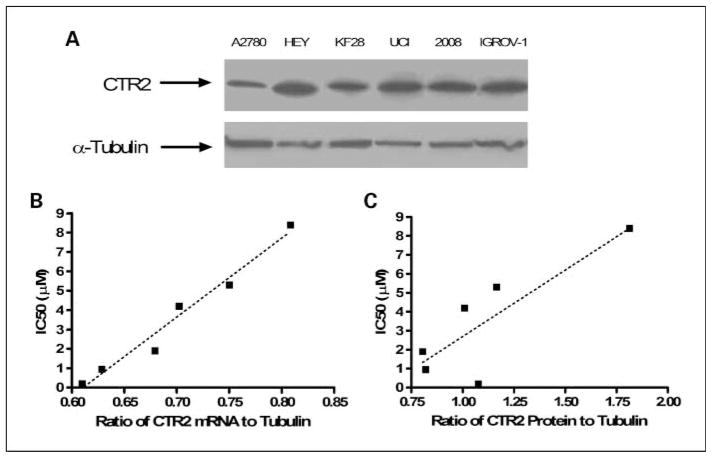
Fig. 5.
Relationship between CTR2 expression and DDP sensitivity in ovarian carcinoma cell lines. A, Western blot analysis of CTR2 in A2780, HEY, KF 28, 2008, and IGROV-1 cells. B, correlation between CTR2 mRNA levels and DDP IC50 of the six ovarian carcinoma cell lines as measured by qRT-PCR (r2 = 0.97, P = 0.0003). C, correlation between CTR2 protein levels and IC50 of the six ovarian carcinoma cell lines as determined byWestern blot analysis (r2 = 0.71, P < 0.04).

