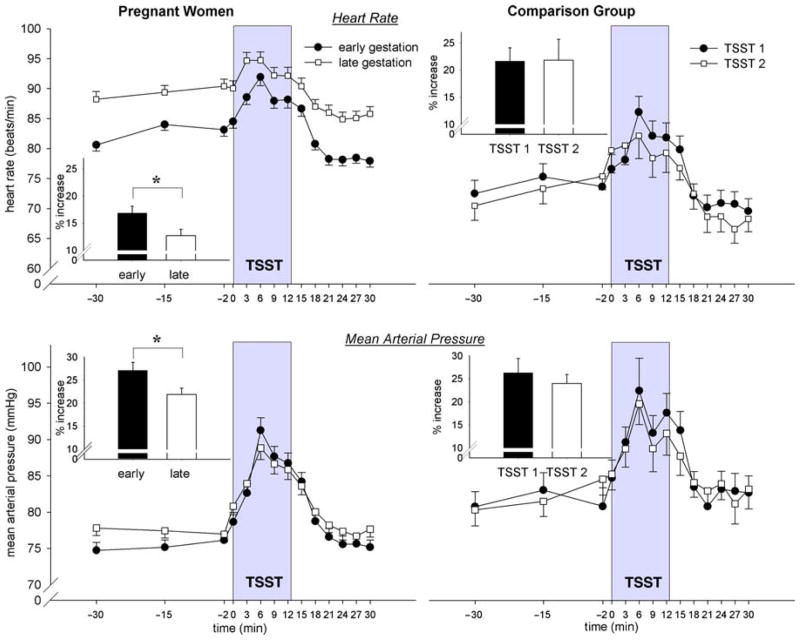
Figure 1.
Mean HR (±SEM) and MAP (±SEM) values before, during, and after the TSST in pregnant women (n = 148) and in the CG (n = 36) for both study assessments. To graphically illustrate the findings of the three-level HLM models, percent increase (±SEM) from baseline is depicted for HR and MAP for both groups. Significant differences (p < 0.05) are indicated with an asterisk.

