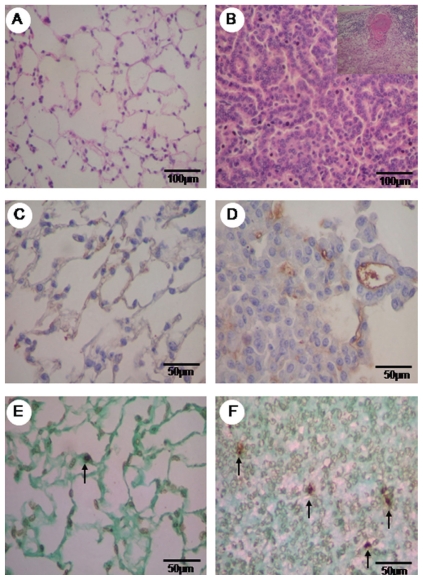
Figure 1.
Hematoxylin eosin (HE) staining of normal parenchyma of the control group (A) and the urethane group, with an adenocarcinogenic area and the detail of the adenocarcinogenic metastasis of the lymph node (B). Vascular caspase 9 is minimally immunolabeled in the control group (C) and shows major expression in the tumor parenchyma (D). Minimal TUNEL (+) staining is observed in the normal area (E) of the control group TUNEL staining is increased in the tumor parenchyma (F). HE in A, B is at 200x, immunohistochemistry for caspase 9 in C, D is at 400x and TUNEL (+) apoptosis in E, F is at 400x magnification.

