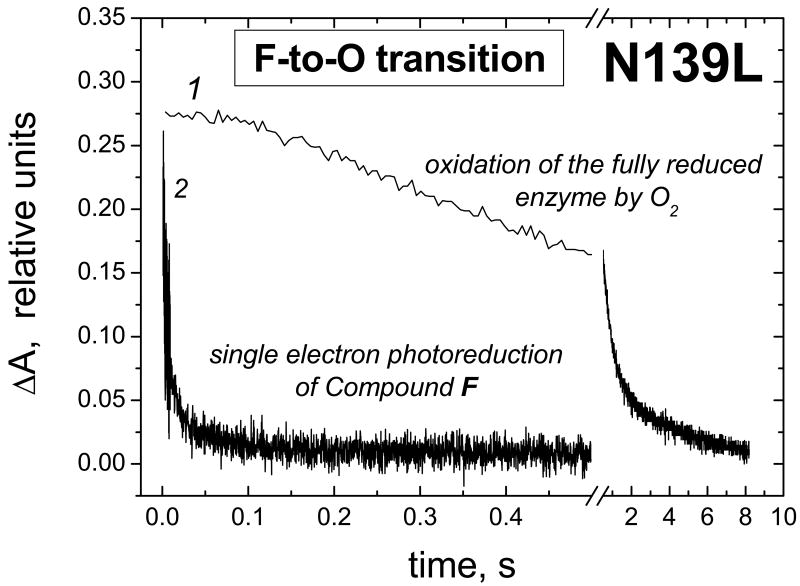
Figure 3. Different kinetics of the F→O transition in N139L mutant oxidase as induced by single-electron photoreduction of Compound F (trace 2) and observed during oxidation of the fully reduced enzyme by O2 (trace 1).
Trace 1, oxidation of heme a followed at 608 minus 630 nm has been constructed from the dataset in Figure 1A. Trace 2, oxidation of heme a measured at 445 nm in the F→O transition triggered by single-electron photoreduction of Compound F (see Figure 4 and Table 1 for conditions and more details). The traces are given normalized to the magnitude of the absorption changes at each wavelength pair.

