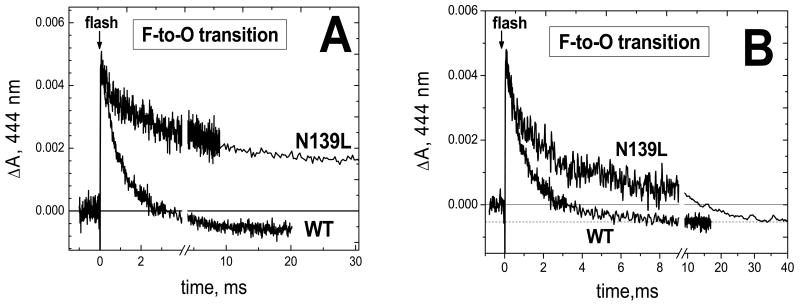
Figure 4. Reoxidation of photoreduced heme a during the F → O transition in the wild type and N139L mutant form of cytochrome oxidase.
The optical cell (see Experimental procedures) contained COX (10-20 μM) in 5 mM Tris-acetate, pH 8, and 0.05–0.1% dodecyl maltoside, with 40 μM RuBpy, 10 mM aniline and 2 mM H2O2. 16 traces have been averaged in each case. The absorption curves have been normalized: (A) by the magnitude of heme a photoreduction and (B) by the magnitude of heme a reoxidation.

