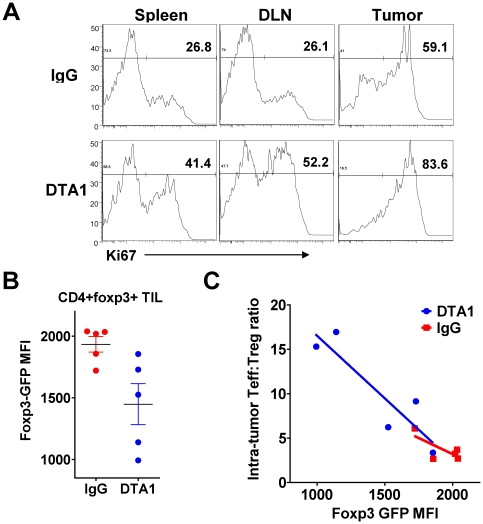
Figure 5. Intra-tumor Tregs show increased proliferation and lower Foxp3GFP MFI after DTA-1 treatment.
A. Representative Ki67 expression within live CD4+foxp3+ cells isolated from day 10 B16-bearing C57BL/6 mice treated with DTA-1 or IgG on day 4. B. and C. TIL were isolated from day 10 B16-bearing foxp3 GFP mice (n = 5/group) treated with DTA-1 or IgG on day 4 and examined by FACS. B. Mean fluorescence intensity (MFI) of GFP on live intra-tumor CD4+GFP+ cells. C. Intra-tumor CD8:Treg ratio of DTA-1- and IgG treated mouse in (B) is plotted against its foxp3GFP MFI, demonstrating a significant inverse correlation between Teff:Treg ratio and foxp3GFP MFI in DTA-1 treated mice only (p = 0.03). Data are representative of 3 independent experiments.

