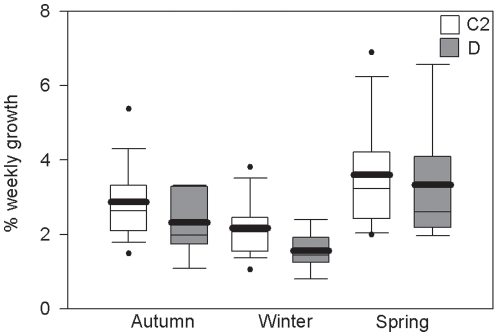
Figure 4. Seasonal growth of Acropora millepora colonies.
The growth rate of colonies of Acropora millepora varied significantly with season in the year before a bleaching event. Boxes represent the weekly buoyant weight gain expressed as a percentage of the initial buoyant weight of the colony. White boxes represent colonies with type C2 symbionts and grey boxes represent colonies with type D symbionts. Box boundaries represent the 75th and 25th percentiles. Thick lines within the boxplots represent the mean and thin lines represent the median. Whisker bars above and below the boxes represent the 95th and 5th percentiles. Missing and out of range values are not shown. Dots represent data that fall outside the confidence limits.

