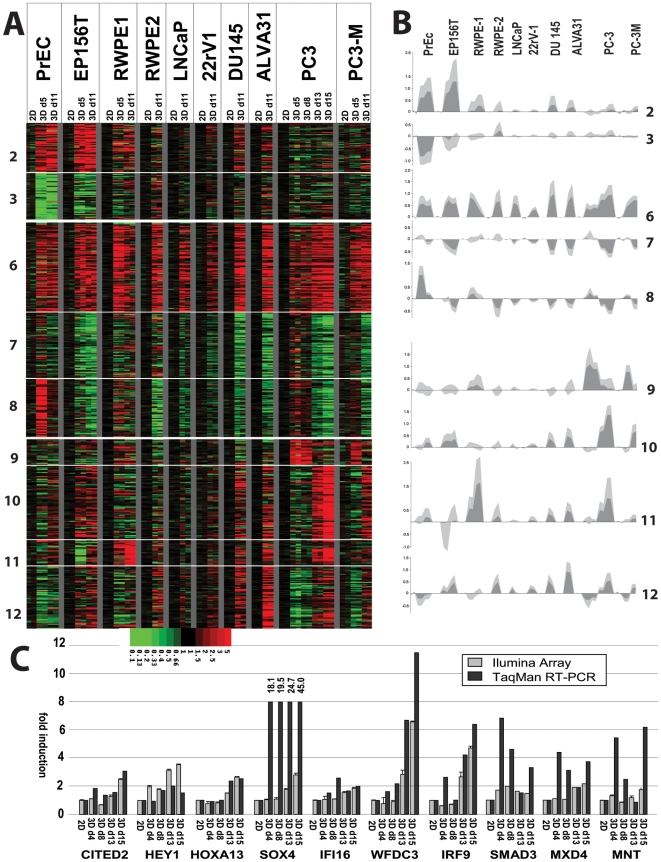
Figure 4. Characteristic patterns of altered mRNA gene expression of cells cultured in laminin-rich ECM (Matrigel), compared to monolayer culture (ratios 3D/2D).
A) Heatmap, illustrating 12 clusters generated by the K-means algorithm. Clusters 1+2 represent genes exclusively affected in normal cells (PrEC, EP156T). Clusters 6–8 represent genes similarly induced or repressed in all cell lines in response to 3D cell culture in Matrigel 3D, regardless of phenotype, or transformation. Clusters 9–12 contain genes characteristic for the stellate/invasive type cell lines (ALVA31, PC3, PC3M, RWPE2/w99), or which are induced during the spontaneous conversion of round to stellate structures (e.g. PC3, day 13 and 15). B) Average expression changes, illustrating the median (dark grey) and variation (light grey) of altered gene expression within clusters. C) QRT-PCR analysis (black) and Illumina array data (grey) for a selected panel of genes, validating increased expression in invasive PC-3 cells.

