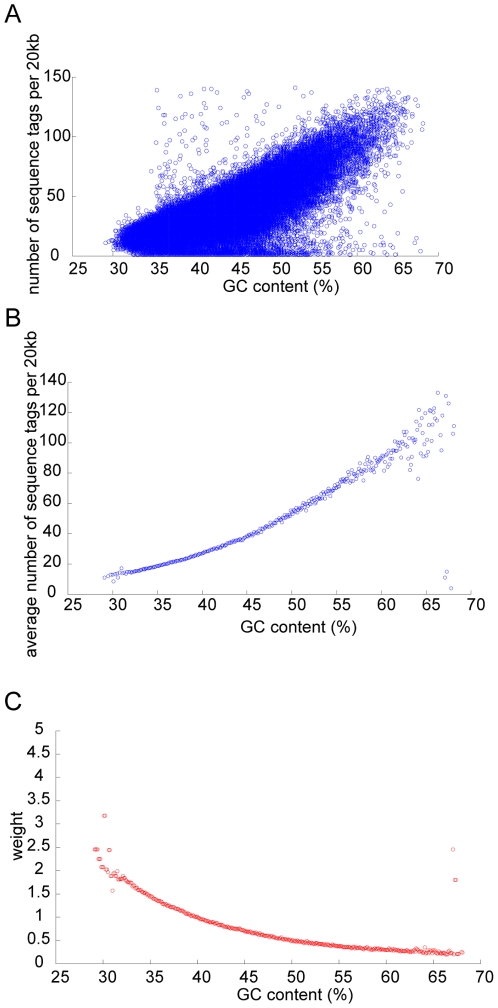
Figure 1. Illustration of the procedures used to remove GC content dependent artifact in shotgun sequencing data using one of the patient samples as example.
(A) The number of sequence tag per 20 kb bin is plotted against GC content of the bin. (B) The average number of sequence tag per 20 kb is calculated for every 0.1% GC content. (C) A weight is calculated for a particular value of GC content, such that sequence tags falling within a 20 kb bin having such GC content would receive the same calculated weight.

