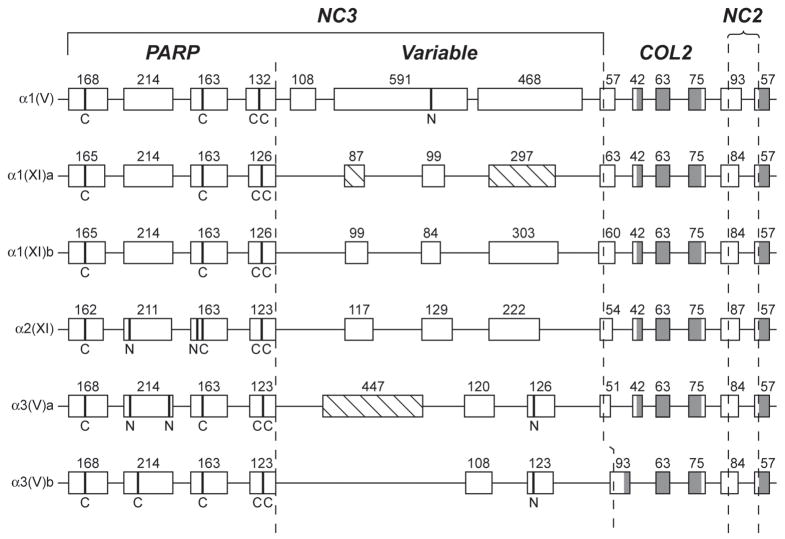
Fig. 3.
Comparison of the intron/exon organizations of NH2-terminal sequence-encoding regions of zebrafish clade B procollagen genes. Boxes represent exons. Numbers represent lengths in basepairs. Shaded and open regions of boxes represent triple-helix and non-triple helix coding sequences, respectively. Dashed lines demarcate PARP-, Variable-, COL2- and NC2-encoding regions. Hatched boxes represent alternatively spliced exons. Sequences encoding cysteines and potential Asn-linked glycosylation sites are marked by broad bands and the letters “C” and “N”, respectively.

