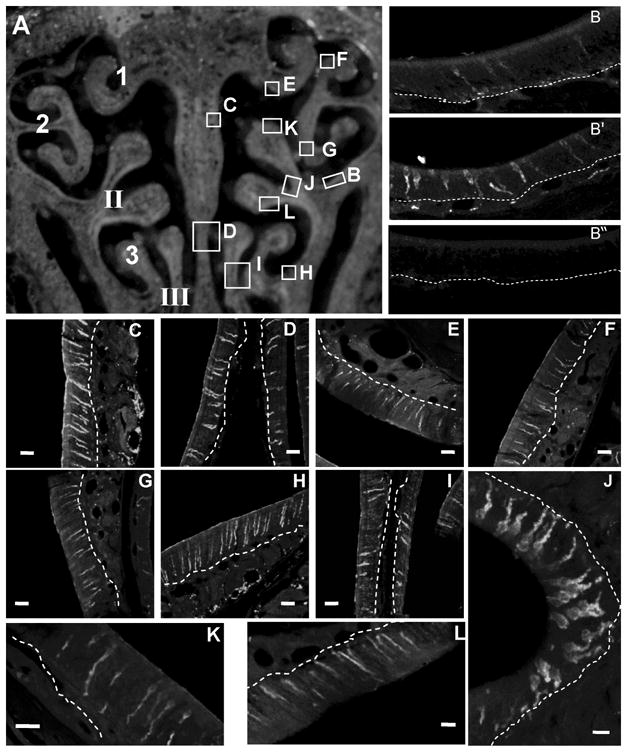
Figure 2. ATP upregulates NPY expression in septum and turbinates of adult mouse OE.

(A) Schematic image of the regions examined. Left: The endoturbinates II, III, and ectoturbinates 1–3 are numbered. Right: Lettered regions correspond to the images shown in B–L. (B, B′, B″) Representative NPY-immunoreactivity (NPY-IR) from a saline-instilled mouse (B), an ATP-instilled mouse (B′) and a peptide neutralization control (B″). (C–L) Representative images of ATP-induced NPY-IR from the lettered regions designated in A. Dashed white lines indicate basement membrane. Scale bars = 5μm.
