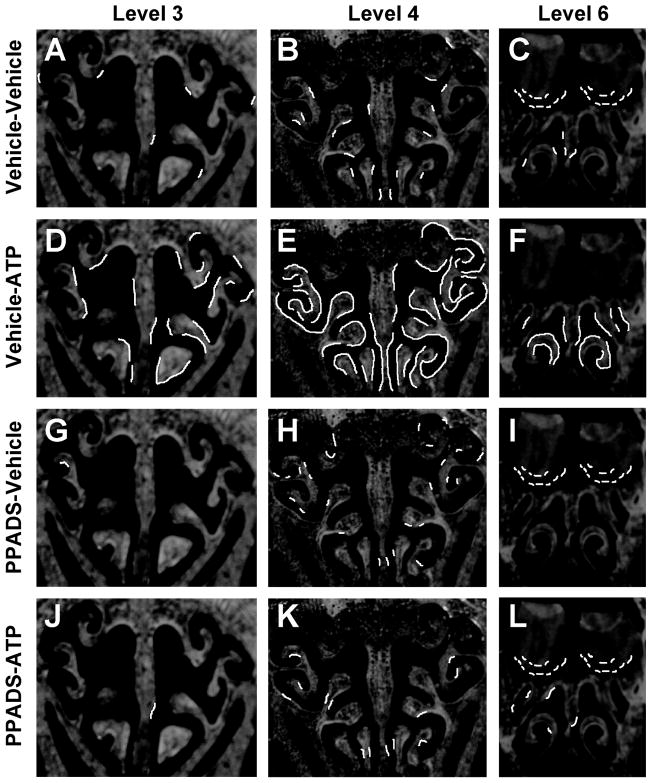
Figure 3. ATP activation of P2 purinergic receptors induces NPY expression in the OE through the whole nasal cavity.
(A–L) NPY-IR expression patterns are overlaid as white lines on representative cryostat sections at levels 3, 4 and 6 of the OE. Very little endogenous NPY-IR is observed in the vehicle/saline group (A–C). ATP induces NPY-IR expression in the vehicle/ATP group (D–F). NPY-IR expression patterns in PPADS/saline group is not different from vehicle/saline group (G–I) however, PPADS pre-treatment blocks ATP-induced increases in NPY expression (J–L).

