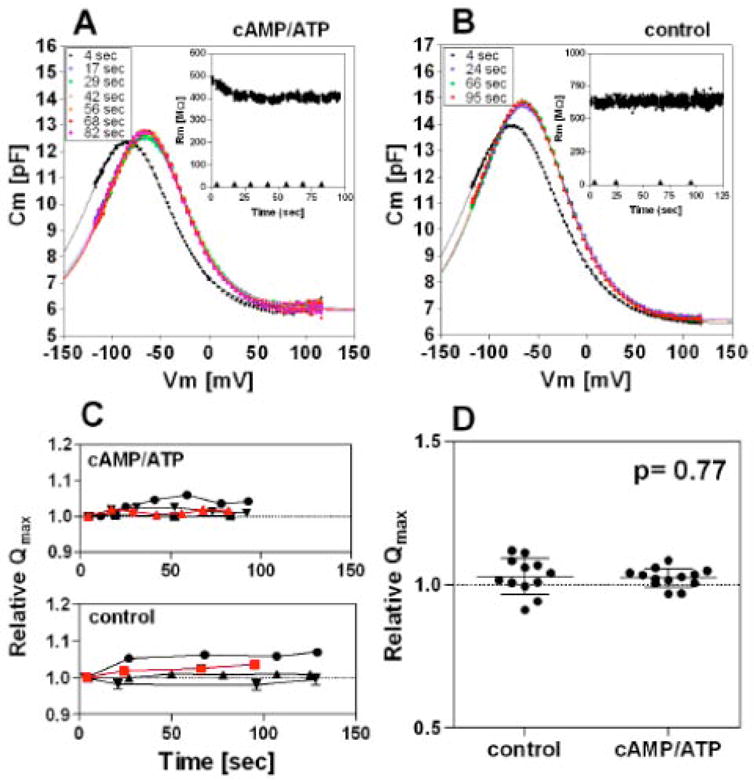
Fig. 10. Effect of CFTR activation on prestin function in isolated OHCs.

Time-dependent NLC was measured on isolated OHCs. (A) An example of the time-dependent NLC measurements when the intracellular pipette solution contained 0.2mM cAMP, 1mM ATP, and 50μM IBMX for activation of CFTR. The inset shows the time course of the membrane resistance (Rm). After establishing a whole-cell configuration, recordings were taken at the time points indicated (◆). (B) An example of the time-dependent NLC measurements without CFTR activation. (C) Time-dependent relative Qmax values with respect to the Qmax measured at the beginning of the time course. Four results are shown for each condition. Error bars indicate variability of the relative Qmax values calculated from the standard errors of the curve fittings of the original NLC data, many of which are too small to be seen. The red symbols show the data points obtained from the time-dependent NLC recordings shown in A and B. (D) Summary of the Qmax change. The data point at the end of each time course was chosen for comparison. For results obtained with CFTR activation, only results showing decrease in membrane resistance were used for the statistical analysis (13 out of 20). The average relative Qmax values were 1.03 ± 0.01 (mean ± s.d., n=13) for recordings with CFTR activation, and 1.03 ± 0.06 (mean ± s.d., n=12) for recordings without CFTR activation. The Student’s t-test failed to find a significant difference (p= 0.77). A statistically significant difference was also not found for α or Vpk values (p>0.05).
