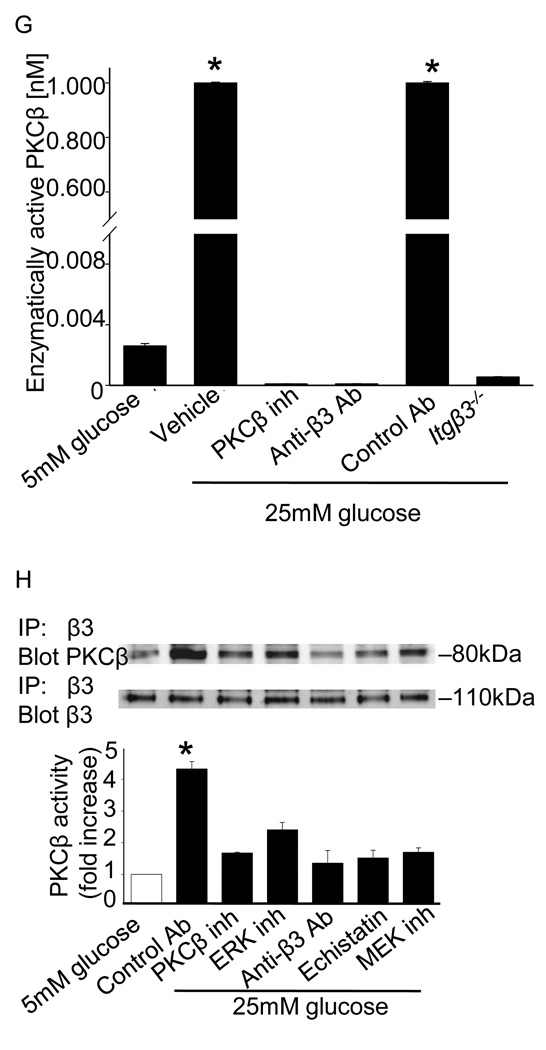
Figure 3. Hyperglycemia triggers PKCβ and integrin β3-dependent signaling in vitro and in vivo.
ERK activation (A) and Akt activation (B) was measured by immunoblotting aorta or SMCs as described in Methods. The results are presented as the level of phosphorylated/total protein normalized to results obtained in euglycemic conditions and are graphed as the mean ± SE from eight independent experiments. ERK activation was measured in SMCs cultured under euglycemic (5 mM) or hyperglycemic (25mM) conditions in the presence of the indicated inhibitors. The results are presented as the level of phosphorylated/total protein normalized to results obtained with 5 mM glucose and are graphed as the mean ± SE from three independent experiments (C). ERK activation was measured by immunoblotting aorta (D) from the Itgβ3−/− mice. ERK activation was measured by immunoblotting aorta (E) or SMCs (F) from the Prkcb−/− mice as described in Methods. The results are presented as the level of phosphorylated/total protein normalized to results obtained in euglycemic conditions and are graphed as the mean ± SE from three independent experiments. Membrane associated PKCβ activity in SMCs was measured as described in Methods, and mean ± SE from three independent experiments are graphed (G). Integrin β3-immunoprecipitates from cells cultured in 5 mM or 25 mM glucose were probed for PKCβ by immunoblotting using a pan-PKCβ antibody (H). Cells were cultured in the presence of the indicated inhibitors for 24 hours. Inhibitors used were as follows: ERK (PD98059, 10µM), MEK (U0126, 10µM), PKCβ (3-(1-(3-Imidazol-1-ylpropyl)-1H-indol-3-yl)-4-anilino-1H-pyrrole-2,5-dione, 5nM), integrin β3 (echistatin, 10µM), anti-β3 antibody (10µg/ml), control antibody (10µg/ml). The fold changes (mean ± SE from three experiments) in the level of PKCβ in the immunoprecipitates relative to results obtained in 5 mM glucose are graphed. *P<0.001 as compared to corresponding control.


