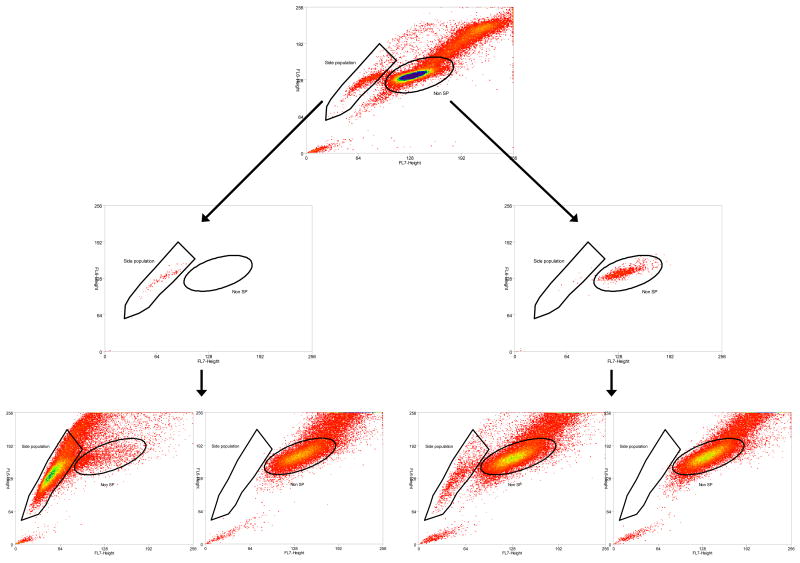
Fig. 3.
Dynamics of C6 side population (SP) and non-SP cells. SP and non-SP cells were sorted, cultured and then re-sorted. The top graph shows original SP and non-SP distribution. The middle graphs show cleanliness of sorting (sorted SP on the left and non-SP on the right). SP and twice-sorted non-SP cells were cultured and the re-sorting results are presented in the bottom graphs. Most SP and non-SP cells maintain their original sorted phenotype, although C6 dynamics is observed. Whereas verapamil addition depletes the SP, SP gives rise to both SP and non-SP (two graphs on the left), and non-SP gives rise to both non-SP and SP (two graphs on the right).

