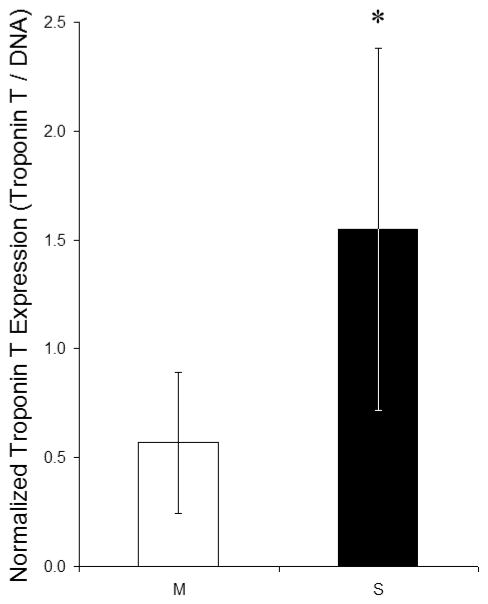
Figure 4.
The normalized troponin T protein expression in engineered cardiac tissue was determined by comparing the fluorescence intensities of immunolabeled troponin T and DNA; only pixels with at least 50% maximum intensity were included, although an intensity cut-off of 12.5% to full intensity could be used without altering statistical significance. *The normalized troponin T expression was significantly higher in SIS gel constructs (S; n = 7) compared to Matrigel constructs (M; n = 5) (p < 0.05, one-way analysis of variance with Tukey-Kramer post-hoc tests). Non-specific Hoechst (DNA) fluorescence intensities in controls containing only Matrigel or SIS gel in PGS scaffolds were <10% for Matrigel and <1% for SIS gel compared to experimental groups, and non-specific troponin T fluorescence intensities in controls were <20% for Matrigel and <1% for SIS gel compared to experimental groups.

