Fig. 10.
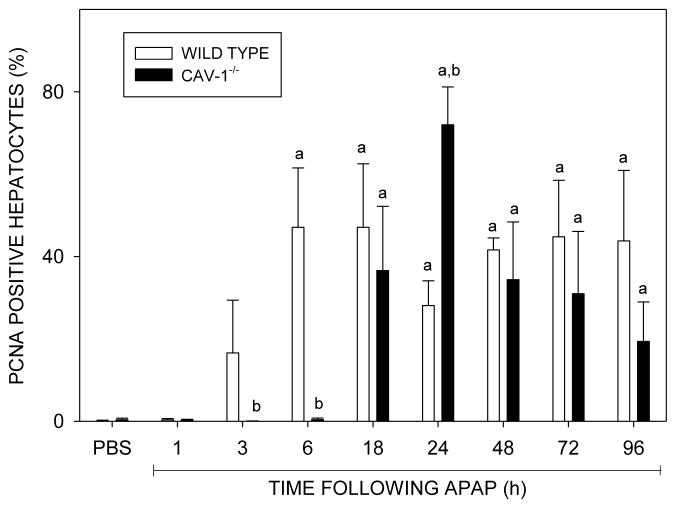
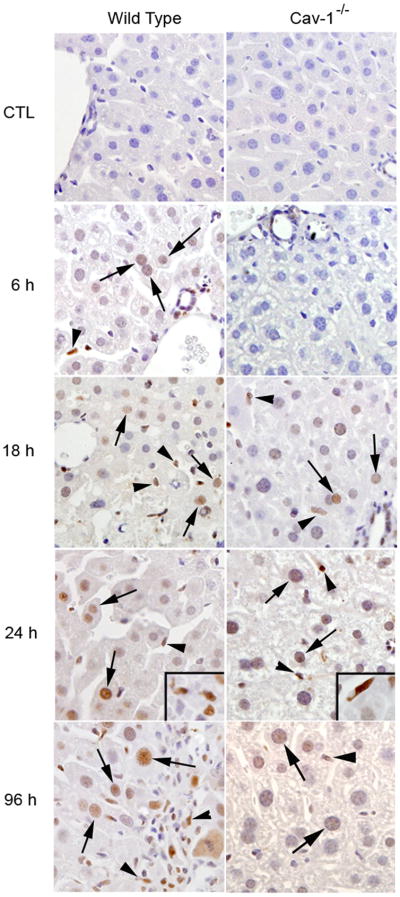
Effects of acetaminophen on PCNA expression in the liver. Sections were prepared 1–96 h after treatment of wild type (WT) or Cav-1−/− mice with CTL or acetaminophen (APAP). Upper panel: The number of PCNA-positive hepatocytes was counted in 5 randomly selected microscopic fields (400x), centered on the portal triad. A minimum of 500 hepatocytes were analyzed in each liver section. Data are presented as % PCNA-positive cells. Each bar represents the mean ± SE (n = 6 sections from 3 mice/treatment). aSignificantly different (p ≤ 0.05) from CTL; bSignificantly different (p ≤ 0.05) from wild type mice. Lower panel: Liver samples from wild type and Cav-1−/− mice were stained with antibody to PCNA. Antibody binding was visualized by using a Vectastain Elite ABC kit (original magnification, X400). Arrows, PCNA labeled hepatocyte nuclei; arrowheads, PCNA labeled macrophages. One representative section from 3 mice/treatment is shown.


