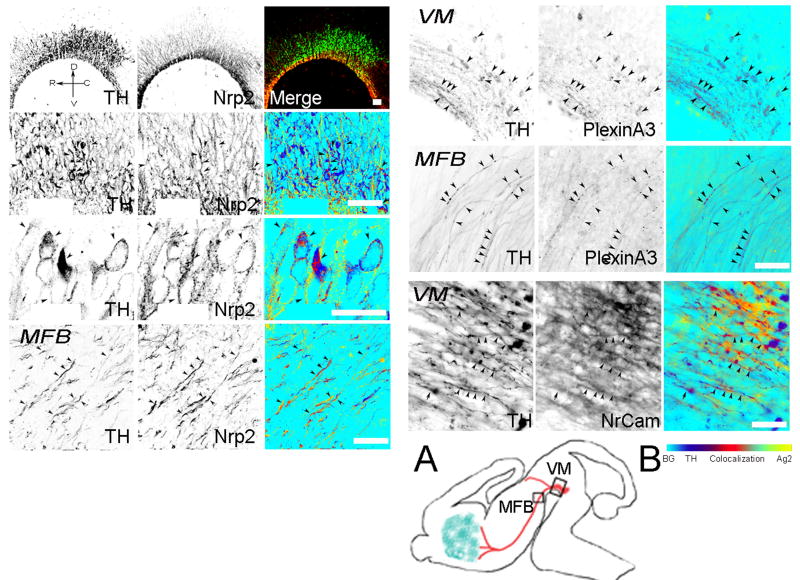
Figure 4. Expression of Sema3F receptors in vivo.
The Sema3F receptor complex comprises Nrp2, PlexinA3 and NrCAM. The figure shows the immunolocalization of the individual components of the Sema3F receptor in the VM of E13.5 rat. Embryos were fixed and 20μm sagittal sections were cut within the region depicted in fig. 1, double-stained with antibodies against TH (green) and Nrp2, PlexinA3 or Nr-CAM (red). Green and red signal co-localization (arrowheads) is shown in the merge panel. In some cases merging was made as described in Fig. 2. (A) Diagram showing the regions where the VM or MFB pictures were taken. (B) Co-localization bar. Picture orientation is represented by the orientation cross in the top left panel. Calibration bars: 50 μm.VM, ventral mesencephalon; MFB, medial forebrain bundle.

