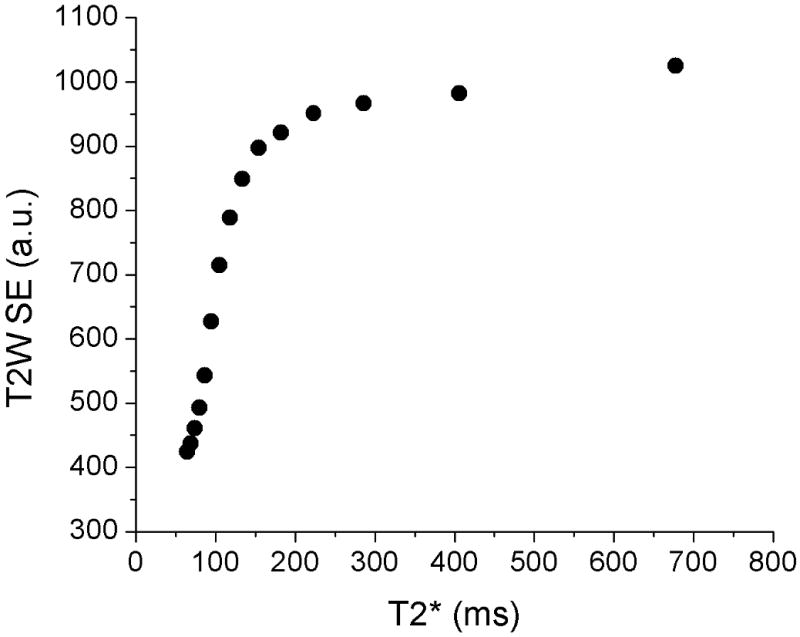
Figure 5.

Association between T2W SE images and GEPCI T2* maps. While Figs. 2-4 show that GEPCI-T2* maps highly resemble the T2W-SE images, the linear relationships between signal intensity in T2W images and corresponding GEPCI T2* relaxation time constants is not expected. Yet certain association between these parameters does exist. The plot displays the relationship between T2* values and the intensity of T2W image. Pixels from white matter on co-registered T2* maps and T2 weighted images were divided into 15 groups by their R2* values ranging from R2*= 1 s-1 to R2* = 16 s-1 (corresponding to the peak center in the subject #5). Each point in the plot represents mean value for the corresponding group. As the plot shows, the T2* and T2W intensity grow proportionally when T2* is below 150ms. However, the T2W intensity reaches plateau for mild and severe lesions while T2* still varies substantially, thus offering better delineation of the MS lesions severity.
