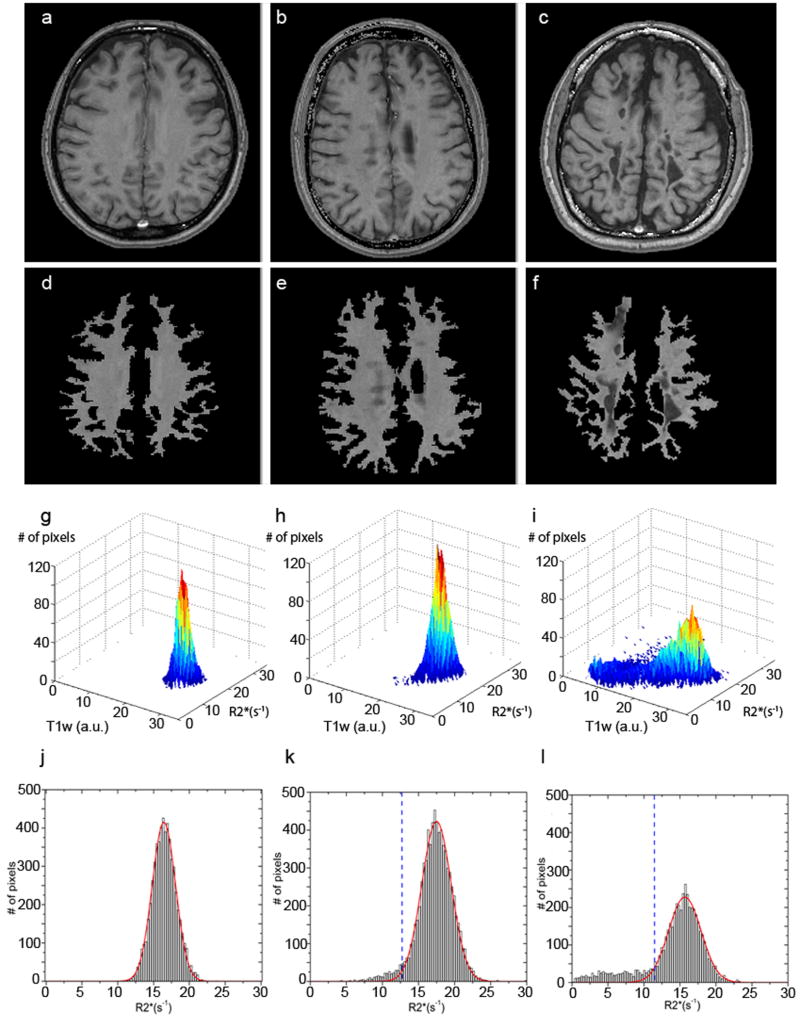
Figure 6.
Different steps of the proposed method for scoring MS severity: a), b) and c) are initial T1W-GEPCI images for three subjects represented in Figure 1 (healthy control), Figure 2 (MS #3), and Figure 3 (MS #5); d), e) and f) are the segmented T1W-GEPCI images using masks as described above; g), h), and i) are 3D histograms of the segmented voxels in the control subject, and subjects with RRMS and SPMS, respectively; j), k) and l) are the corresponding R2* histograms. Red lines represent Gaussian fits obtained by using only the upper half of the data in histograms and then extrapolated to all the other remaining R2* values. Note that histograms here are shown for selected images, not for the whole brain. Dashed blue lines represent threshold values defined for each slice. Notation a.u. stands for arbitrary unit.

