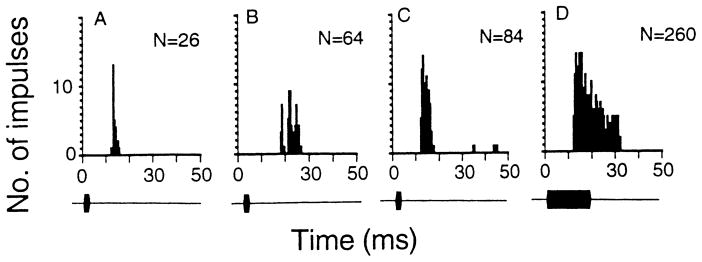
Fig. 1.
A–D The post-stimulus-time (PST) histograms showing the discharge patterns of three representative inferior collicular neurons: phasic responder (A), phasic burster (B) and tonic responder (C, D). When stimulated with acoustic stimuli of 3 or 19 (not shown) ms, the phasic responder discharged 1–2 impulses (A) and the phasic buster discharged 3–10 impulses (B). In contrast, the tonic responder discharged impulses throughout the entire duration of the acoustic stimulus (C, D). N: number of impulses discharged to 16 stimuli. The BF (kHz) and MT (dB SPL) of these three neurons were 59.9, 31 (A); 38.7, 33 (B) and 64.0, 52 (C, D). The stimulus intensity used to obtain these PST histograms was always 80 dB SPL. Bin width: 500 μs, sampling period: 300 ms. To highlight the discharge pattern, the sampling period beyond 50 ms is not shown

