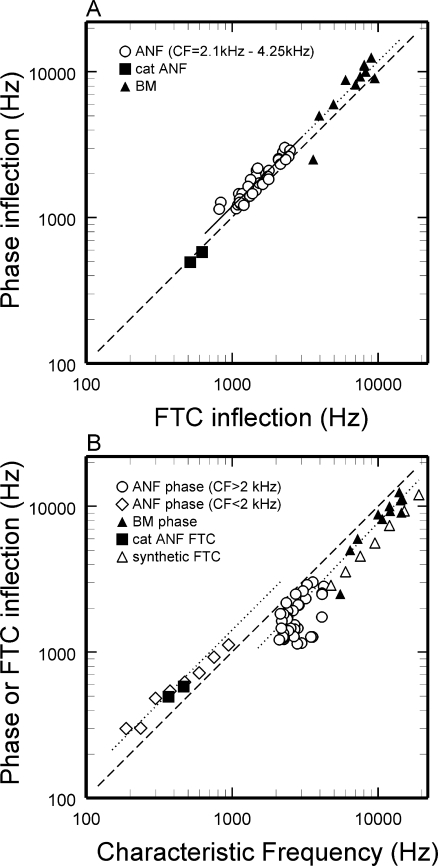
FIG. 14.
Inflection frequencies of phase–frequency functions and FTCs of ANFs and BM responses in chinchilla. Open circles: data for 36 chinchilla ANFs. Filled squares: data for two cats ANFs (Fig. 12 of Kiang 1984). Filled triangles: BM data (Ruggero et al. 2000). A Inflections in phase–frequency curves plotted against inflections of ANF FTCs or BM tuning curves. Solid line is a linear regression line. Dashed line indicates equality between inflection frequencies and CF. B Frequencies of inflections in ANF or BM phase–frequency curves and ANF FTCs, plotted against CF. Open triangles: inflections in synthetic FTCs of chinchilla ANFs (from Fig. 7 of Temchin et al. 2008b). Dotted lines indicate frequencies 0.5-octave higher and lower than CF.

