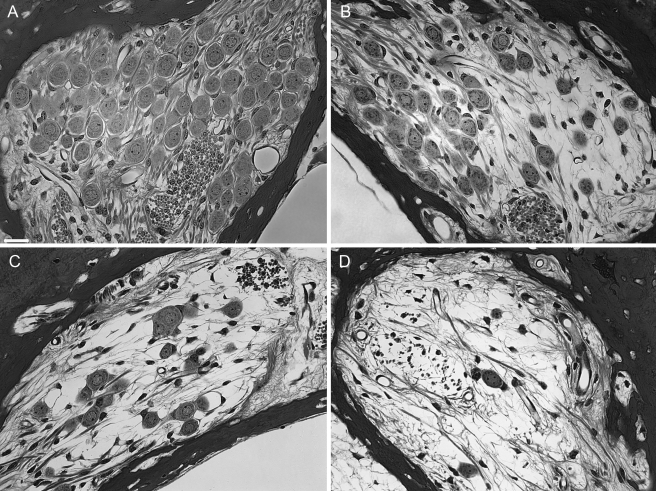
FIG. 5.
Light micrographs showing the spectrum of spiral ganglion neuron (SGN) cell body survival in profile “a” in three group I animals (A–C) and one group II animal (D). Profile “a” was adjacent to the electrode array. A Animal 350, which displayed an SGN survival of 907.6 cells/mm2. B Animal 399, which showed a surprising reduction in SGNs (306.7 cells/mm2) despite having surviving hair cells in the region. C Animal 348, showing SGN reduction (418.6 cells/mm2) in the same region in which degeneration of hair cells occurred. D Group II animal, with severe degeneration of SGNs following intracochlear neomycin treatment. The average SGN density of the group II animals was 171.9 cells/mm2. The selection of subjects does not necessarily coincide with Figure 4. Scale bar represents 20 μm.

