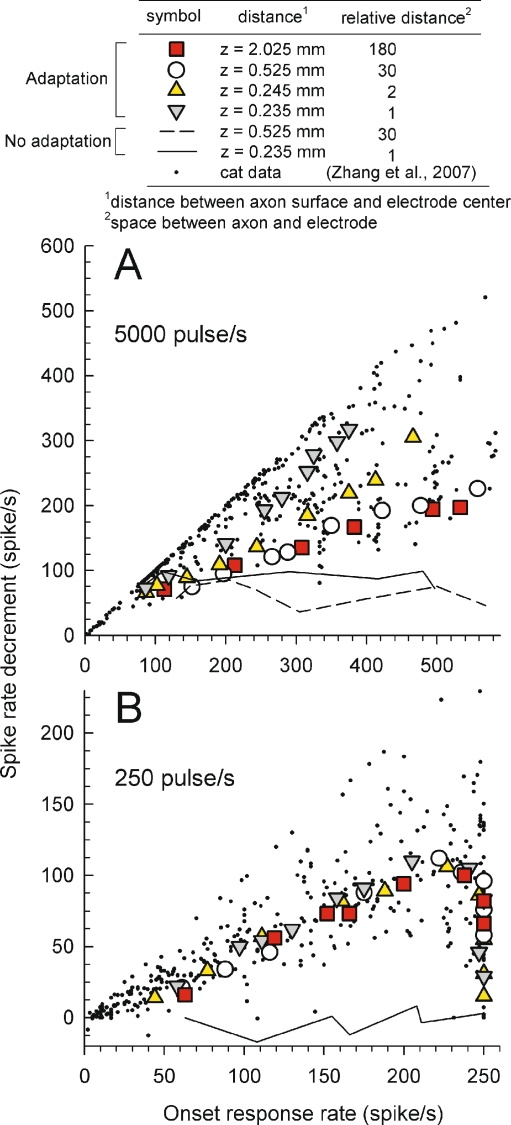
FIG. 7.
Characterization of rate adaptation across response rates indicates that modeled responses to 5,000 pulse/s trains (A) result in greater adaptation than do the 250 pulse/s trains (B), although axon-to-electrode distance produces an interaction. Spike-rate decrements from cat ANFs are plotted using dots and the line and dashed line plots indicate results obtained by the model with the adaptation component deactivated, essentially indicating a noise floor. Different symbols indicate data from the adaptation model for different electrode-to-fiber distances. The model axon diameter was fixed at 2.3 mm, and the electrode was positioned close to 9th active node.

