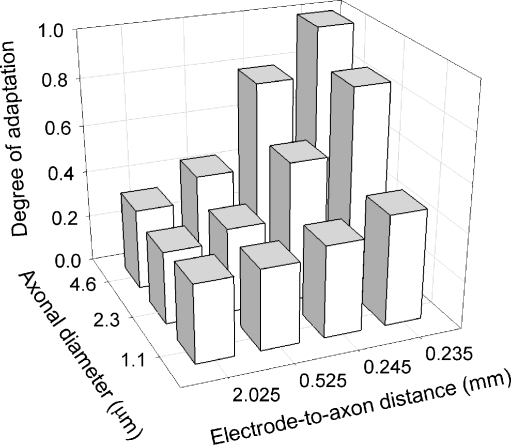
FIG. 8.
Summary of model sensitivity to rate adaptation with changes in axon diameter and electrode-to-axon distance. The degree of adaptation represents the slope of the linear regression computed for each data set of Figure 7. A “degree of adaptation” value of 1 corresponds to complete loss of spikes in the final, steady-state analysis window. Note the non-linear scale for the electrode-to-axon distance.

