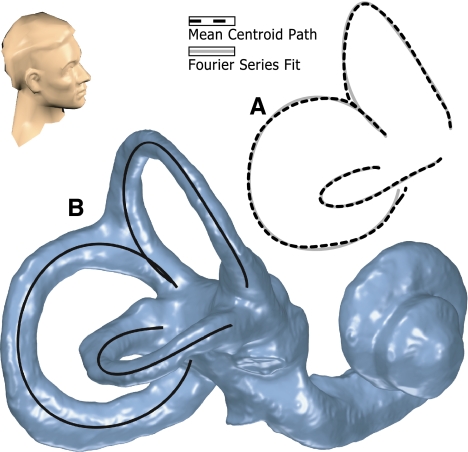
FIG. 3.
Fourier series model of the SCCs. A Plot of the average SCC geometry shown against the corresponding Fourier series model of that data, shown from a superior-right point of view. This illustrates the closeness of fit that is achieved with this model. B Also demonstrated for an individual ear where the SCC model is shown superimposed on the bony labyrinth reconstruction.

