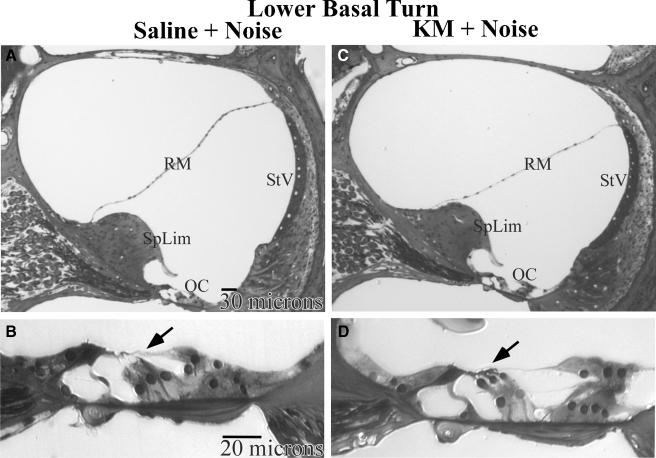
FIG. 6.
Light photomicrograph of the cochlear lower base (~40 kHz region) in the same example mice depicted in Figure 5, receiving Saline + Noise (A, B) or KM + Noise (C, D). The sole clear distinguishing feature is the absence of outer hair cells in the saline-treated animal (arrows in B, D). StV Stria vascularis; RM Reissners membrane; SpLim spiral limbus; OC organ of Corti.

