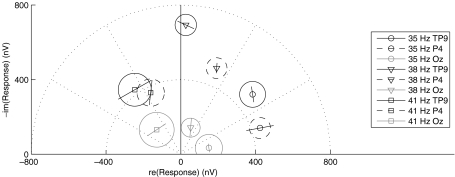
FIG. 11.
Polar plot of the complex responses to show polarity, noise, and recording electrode influence on phase delay for subject S5 at C level for the pulse rates 35, 38, and 41 Hz on recording electrodes TP9, P4, and OZ. Error bars show the difference between the polarities; circles denote the noise level derived from the neighboring bins for the averaged case.

