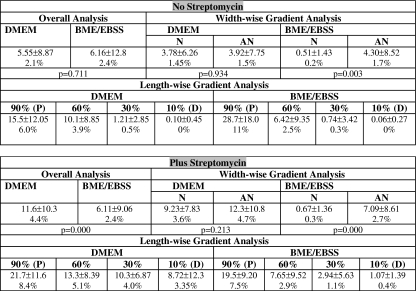
TABLE 2.
BrdU labeling densities at 3 days in vitro
The average number of BrdU-labeled nuclei per 10,000 μm2±S.D. is shown for BPs cultured with either no streptomycin (top) or plus streptomycin (bottom) and in either DMEM or BME/EBSS containing 10% FBS. Data are also expressed as a percentage of total SCs (assumed to be 260 SCs per 10,000 μm2). For the Overall Analysis, all regions were combined to obtain an average. For the Width-wise Gradient Analysis, data from the proximal (90%) region were omitted, and data from the remaining three length-wise regions were combined to obtain an average for each width-wise region. For the Length-wise Gradient Analyses, data from the two width-wise sites were combined to obtain an average for each length-wise site. N = neural, AN = abneural. P = proximal, D = distal. p values apply to ANOVA

