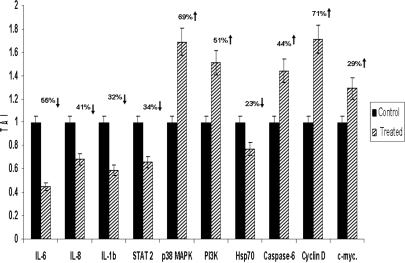
Figure 4.
Ashwagandha treatment significantly modulates gene expression in PC-3 cells. Graphical representation of quantitative changes in gene expression by real-time PCR. Relative mRNA species expression was quantitated and expressed as transcript accumulation index (TAI= 2–ΔΔCT), calculated using the comparative CT method. All data were controlled for quantity of RNA input by performing measurements on an endogenous reference gene, β-actin. In addition, results on RNA from Ashwagandha-treated samples were normalized to results obtained on RNA from the control, untreated sample. Data are the mean ± SD of three separate experiments done in triplicate. Statistical significance was determined by ANOVA.

