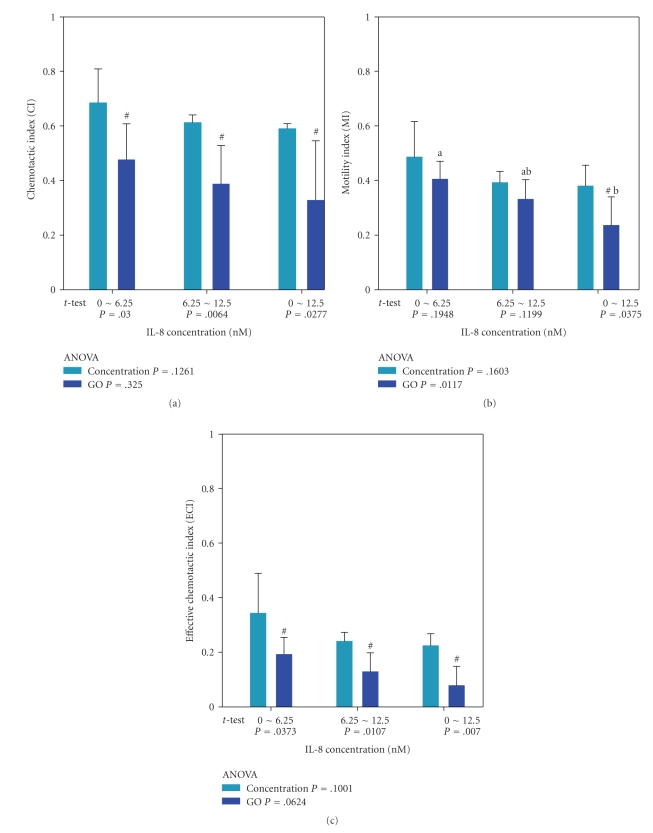
Figure 2.
The average values of (a) CI, (b) MI, and (c) ECI of a test and a control groups of neutrophil-like cell migration under a fixed flow rate of 1.5 μL/min with varying IL-8 chemoattractant gradients across a 400-μm-wide main microchannel (cell migration region). The test group of the cells was treated with 3 μg/mL concentration of GO while the control group was not GO-treated for comparison. Data are given in the form of mean ± S.D. (n = 6). #: Significant difference between the test and the control groups at the same range of IL-8 gradient (P < .05). a, b mean that the test groups not sharing the same superscript letter are significantly different (P < .05).

