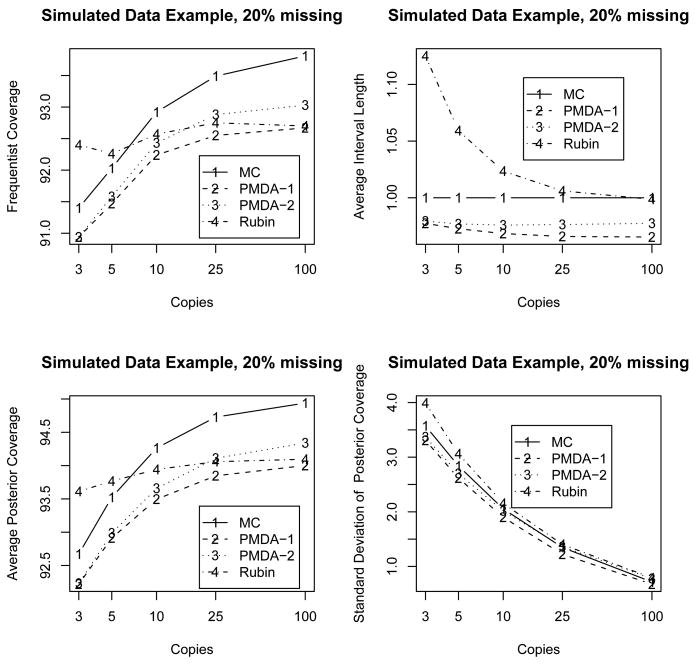
Figure 1.
Simulation results for estimation of the lower tail probability, Φ(ξ = −1.96), of a normal distribution for simulated normal datasets with 20% missing where results are the average over 10,000 random datasets. The top left figure contains the estimated frequentist coverage probabilities of the associated 95% intervals. The top right figure contains average interval lengths relative to the 95% confidence interval length for the mixture method with draws from the true posterior distribution (MC). The lower left figure contains estimated posterior coverage probabilities for 95% confidence intervals for the lower 2.5-th percentile, Φ(ξ = −1.96). The lower right figure contains the standard deviation for observed interval lengths relative to the 95% confidence interval length for the mixture method with draws from the true posterior distribution (MC).

