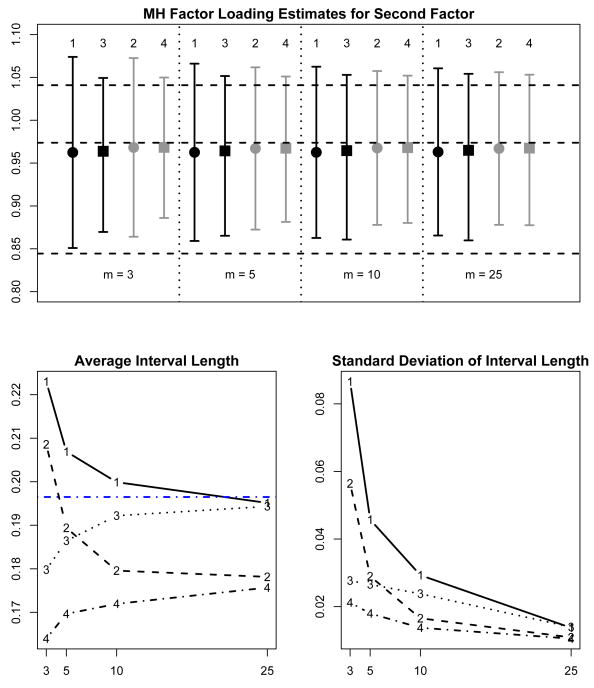
Figure 3.
Quality of Life example: 100 replications of multiple imputation for two methods of summarizing (Rubin's t [1, 2] and mixture of normals [3,4]) using copies of missing data generated from two different models (from the target factor analysis posterior distribution [1,3] and general multivariate normal [2,4]). The top subfigure shows the average of the estimates for the Mental Health loading for the second latent factor (square or circle) and the associated 95% confidence limits (error bars) for the various methods of summarizing and generating for m = 3, 5, 10, and 25 copies. The horizontal dashed lines show the maximum likelihood estimate and 95% confidence limits obtained from the non-parametric bootstrap. The lower left subfigure shows the average interval width and the lower right subfigure shows the standard deviation of the interval widths. In the lower left subfigure, the horizontal dashed line is the interval width from the bootstrap sample.

