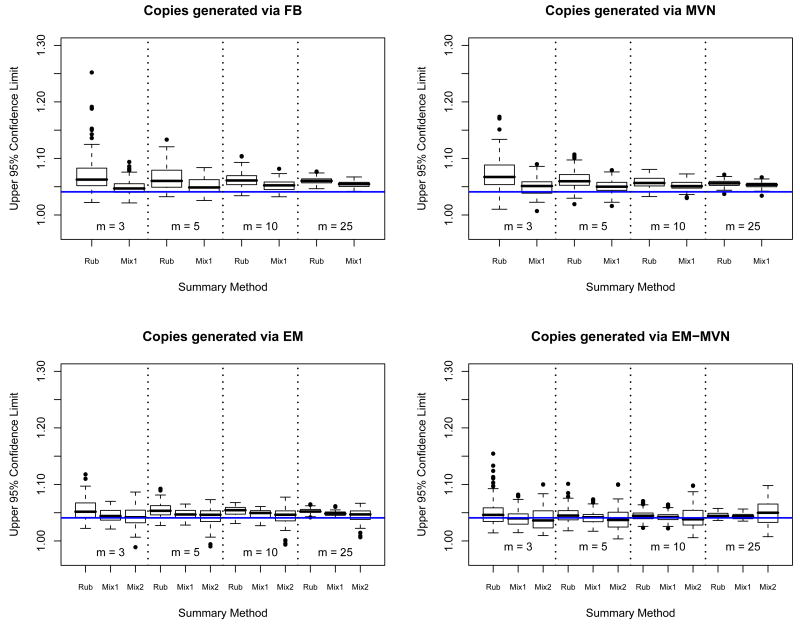
Figure 6.
100 replications of 95% upper confidence limits for the three methods of summarizing (Rubin's t [Rub], PMDA-1 [Mix1], and PMDA-2 [Mix2]) using copies of missing data generated from four different models (from the target factor analysis posterior distribution [FB], full conditional distribution conditional on MLE [EM], general multivariate normal [MVN], and full multivariate normal conditional distribution conditional on MVN MLE [EM-MVN]). The solid line represents the estimate of the upper confidence limit from 5000 bootstrap samples.

