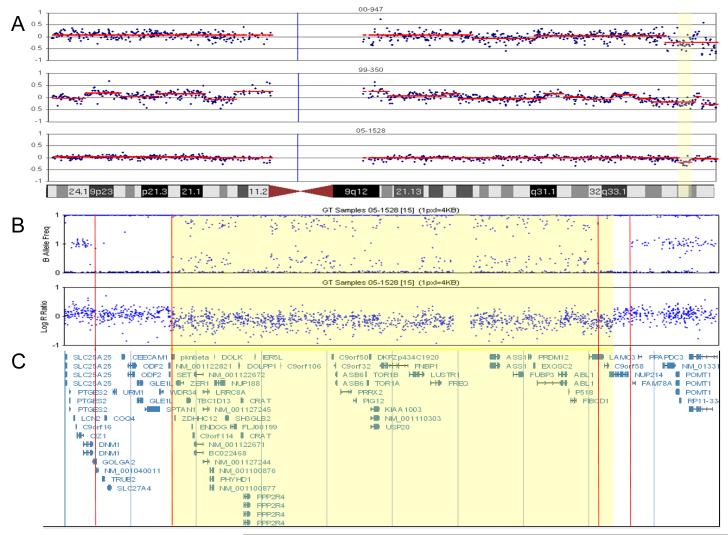
Figure 1.
A. BAC array CGH results of three NK B-ALL samples with recurrent deletion on chromosome 9. The yellow region is the minimal critical region of the deletion. Each plot represents the log2 test/control value for each BAC (in blue) as well as the segmented value (in red). This value is equivalent to the LogR ration in panel B.
B. CNV/SNP array (Illumina 1M Duo) results defining the breakpoints in sample 05-1528. Top plot is the B Allele Frequency (BAF). The BAF is the percent of the sample that has the B Allele for a given SNP. A BAF of 0 indicates the SNP is AA and BAF of 1 means the SNP is BB and a BAF of 0.5 is AB. Note, the BAF in 05-1528 deviates from the normal three band pattern at 9q34.11. The double heterozygous band is indicative of a deletion with ~25% normal cell DNA contamination, and is supported by the decrease in the LogR ratio in panel B. The Log R ratio value is the log2 of test/normal for each SNP. Note the loss of material at 9q34.11. The two sets of red lines indicate regions of uniparental disomy (UPD) observed as loss of heterozigosity flanking the rearrangement. The lack of contaminating normal suggests that these UPD regions are in the germline. The yellow highlighted region defines the region of copy number loss. C. Genomic description of the deleted area.

