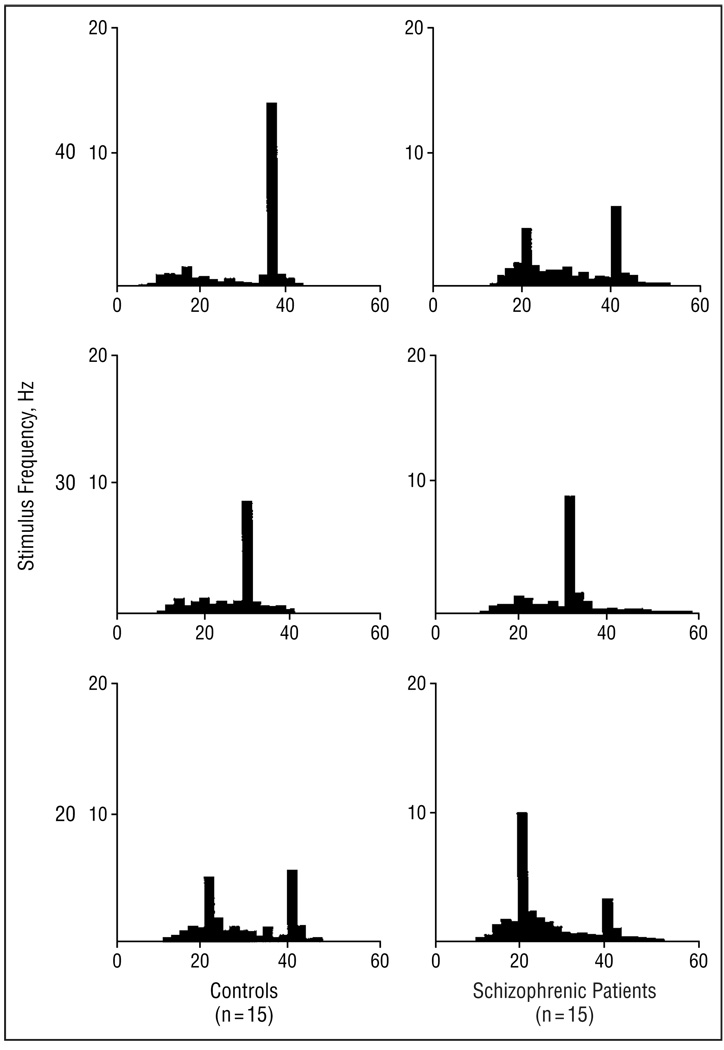
Figure 3.
Mean power (in microvolts squared) spectra (y-axis) for electroencephalograms recorded to trains of clicks at the following 3 stimulus rates: 40 Hz (upper), 30 Hz (middle), and 20 Hz (lower). The schizophrenic patients (n = 15) show decreased power at 40-Hz stimulation compared with control subjects (n = 15), but there was no difference between groups at lower frequencies of stimulation.

