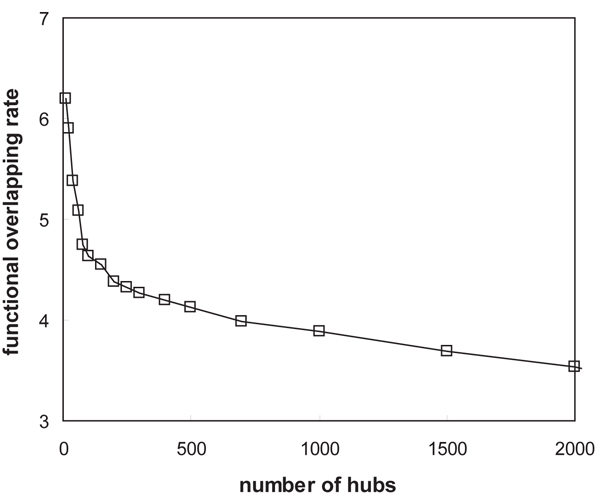
Figure 7.
Average functional overlapping rates of proteins with respect to their hub confidence scores. We arranged the proteins in the yeast interaction network by their hub confidence scores in descending order, and counted the number of functions that each protein performs. The functional categories on the 3rd level in a hierarchy from MIPS were used. Top 10 structural hubs have an overlapping rate approximately 75% higher than the 2000th protein.

